Convenience-store operating decisions
National industry figures can help you choose a question. A local operating record is what helps you decide whether to change a message, reuse supplies or buy something.
Use convenience-store industry data as context, then check the specific condition at your store. A national sales total does not tell you how many catering cups, printed labels or pickup signs your location needs. A store count does not tell you how many customers will use your service.
Keep three things separate: what the source measured, what you have observed locally, and the decision you can reasonably make from that evidence. An unanswered local question is a reason to investigate, not a quantity to fill with a national average.
Record the date, unit and scope before using a figure
A report year is not necessarily the measurement date
The 2026 NACS/NIQ TDLinx store-count page, reviewed November 4, 2026, reports 151,975 U.S. convenience stores as of December 31, 2025. Its latest page-update date is November 3, 2026. Those are different dates; neither makes the count a live November tally.
The page also labels 63% as single-store operators in its highlights, while its body associates that percentage with companies owning ten or fewer stores. Those categories are different. We do not use that percentage to draw an ownership conclusion here. Preserve the uncertainty rather than quietly choosing the more convenient wording.
Industry sales dollars are not product units
The NACS release dated April 15, 2026 reports $341.2 billion in 2025 in-store sales, up 1.7% over 2024. It describes submissions from companies representing more than 35,000 stores, using the State of the Industry survey and self-reported CSX data.
That dollar change is not a count of drinks, customers or packaging units. The public NACS survey page explains the benchmarking purpose and participation process. We have not independently audited its sample or reviewed the full paid report. Aggregate benchmarking can frame a local question; it does not identify your location’s supply requirement.
A useful source note contains the publisher, exact page, publication or update date, measurement period, unit, covered population and any unresolved definition. Keep the date next to the figure when sharing it with a colleague. Do not turn a historical national figure into “today’s demand” by removing that context.
Turn the industry topic into one observable store question
Suppose foodservice coverage prompts an owner to review pickup service. Instead of “Should we buy more branded materials?”, ask: During the noon period we observe, how many completed pickup parties ask where to collect their order? That narrower question identifies a possible communication task.
For this example, a party means one group completing a pickup handoff observed by the employee. Count that party once in the denominator. If someone in the group asks the location question three times, count the party once in the question total. A separate readiness or missing-item question is not automatically a location question.
Count only location questions belonging to the same observed, completed-handoff cohort. Do not mix in passersby, unrelated checkout transactions or repeat questions as additional parties. Incomplete or unobserved handoffs need their own notes; this measure does not describe all arriving customers or the people who leave without completing pickup. Aggregate counts are sufficient for the illustration—customer names and order details are unnecessary.
Use the denominator that matches the question
Fictional local record: Ridgeline Market planned four noon-to-1 p.m. observations in one week. The table describes only those windows, not a random sample of its customers.
| Planned window | Observed completed pickup parties | Parties asking the location question | Context and status |
|---|---|---|---|
| Monday, noon–1 p.m. | 20 | 6 | Ordinary weekday; observation completed. |
| Tuesday, noon–1 p.m. | 24 | 4 | Ordinary weekday; observation completed. |
| Thursday, noon–1 p.m. | Unknown | Unknown | No observer available. Not recorded. |
| Saturday, noon–1 p.m. | 35 | 15 | Local festival nearby; keep separately tagged. |
What the two ordinary observed windows show
Location-question parties: 6 + 4 = 10.
Observed completed pickup parties: 20 + 24 = 44.
10 ÷ 44 × 100 = 22.7%, rounded to one decimal place.
This describes 10 of 44 parties in two observed hours under the stated counting rule. It is not a storewide customer rate, a prediction or evidence that 22.7% of orders are wrong.
Do not add Thursday as a zero: the observation is missing. Do not average Monday’s 30% and Tuesday’s 16.7% without accounting for their different denominators. Combining the actual counts answers the combined-window question.
Saturday shows 15 of 35 observed parties, or 42.9%. Keep the festival tag visible. It may justify looking separately at event-day instructions, but the record does not prove that the festival caused the questions. Pooling all three observed windows would answer a different question from the ordinary-weekday one.
Make the next decision small enough for the evidence
These observations support checking the first pickup cue and the route it describes. They do not establish how many signs to buy or whether a label is the cause of the questions. An employee should walk the actual route and compare the message with the service in use. Our guide to pickup signs and order identification addresses that separate operating task.
A sensible provisional decision is: inspect the cue, correct an inaccurate instruction and try a replaceable notice where needed. Keep the existing materials if they already communicate the correct route. If the questions concern readiness rather than location, investigate that process instead of making the location sign larger.
Example decision note
Observed: 10 location-question parties among 44 observed completed handoffs in two ordinary noon windows. Thursday missing; festival Saturday separate.
Next action: check whether the first pickup instruction is accurate and visible along the actual route. If a change is needed, test the corrected wording with a replaceable notice.
Review: observe comparable ordinary noon windows using the same cohort and counting rule. Note staffing, service or route changes. Keep event-day observations separate.
Not established: the cause of the questions, a reliable whole-store rate, sales impact or a requirement to purchase printed materials.
If a later count changes, inspect the conditions before claiming the notice caused an improvement. This limited record is a starting point for a local check, not an experiment demonstrating a business effect.
Let a confirmed task determine the printed supply
Keep observation totals, dates and changing instructions in records your team can update. Consider custom labels and stickers only for an identified, stable information task on a suitable surface. A sector’s size is not a reason to replace useful materials.
custom product labels
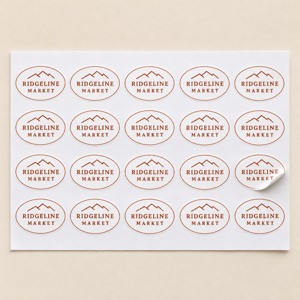
The current SKU decentcustom-st-000009 page lists oval shapes, material and finish choices, and customizable sizes. Its white-paper description is for indoor, dry use. The illustrated folder mark is stable identification; it is not an analytics tool or a customer pickup instruction.
Quantity starts at 1 ordering unit; the package refers to sheets without establishing labels per sheet. Confirm the selected configuration and finished-label quantity before ordering. The picture does not establish dimensions or adhesive performance.
AI artwork concept with a fictional Ridgeline Market mark. Visible sheet count is illustrative. Click the small image for the exact product page.
At DecentCustom, review the artwork and actual configuration if the local task calls for a custom item. Keep the decision note with its evidence. The useful result may be a clearer message, continued use of existing supplies or further observation; a new order is only one possible outcome.