A longer billing period can show more water used even when the daily average is unchanged. Compare the service days and volume first, then investigate what the result can—and cannot—tell you.
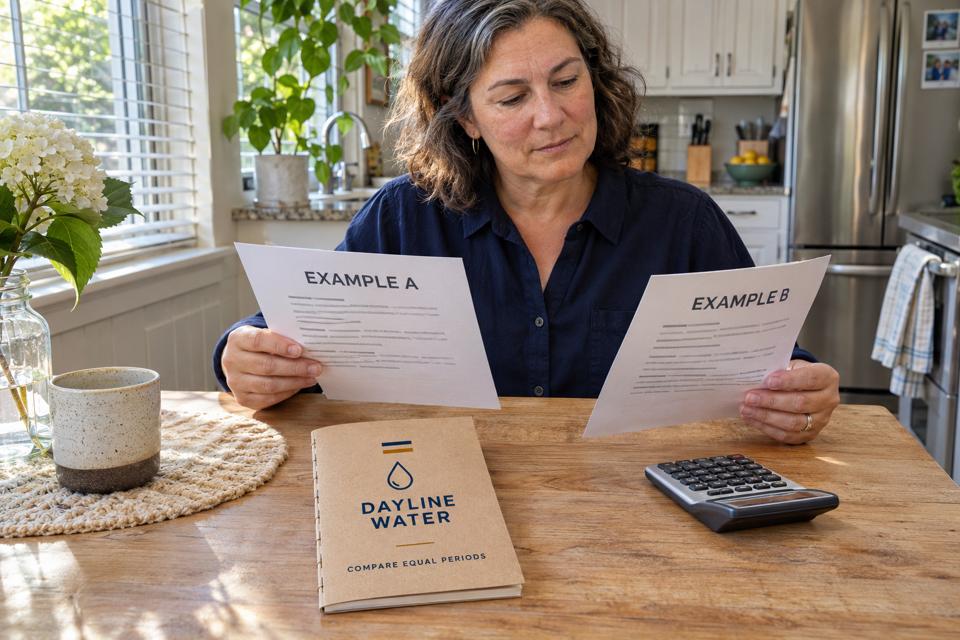
Divide the volume by the service days
To compare water use across unequal billing periods, put both volumes in the same unit and divide each by its own number of service days. Keep the original totals, dates and reading status alongside the daily averages. This removes one obvious difference—the length of the period. It does not make every other condition equal.
Start with the water-use line, rather than the amount due. Find the beginning and ending service dates, the stated number of days, the volume and its unit, and whether the readings are actual or estimated. Payment due dates are not service-period boundaries. If the bill does not state the day count clearly, ask the utility which period it covers rather than assuming every month has 30 days.
The EPA guide to understanding water bills explains common volume units, including CCF, and separates fixed charges from charges based on use. It also describes different rate structures. A change in dollars therefore needs a different comparison from a change in gallons.
For a World Water Day discussion, two old bills can make a useful practical exercise. A community host can demonstrate the calculation using fictional figures, without collecting visitors’ account numbers or displaying private bills.
A higher total can still mean the same daily average
These examples assume the same household meter, confirmed US-gallon volumes and stated service-day counts. Both readings are actual, with no estimated-reading adjustment. The figures are invented to explain the method.
Example 1: only the period is longer
Bill A: 6,000 US gallons over 30 service days.
6,000 ÷ 30 = 200 US gallons per day.
Bill B: 7,000 US gallons over 35 service days.
7,000 ÷ 35 = 200 US gallons per day.
Total-volume change: (7,000 − 6,000) ÷ 6,000 × 100 ≈ 16.7% higher.
Daily-average change: (200 − 200) ÷ 200 × 100 = 0%.
Useful conclusion: the longer period has a larger total, while the calculated daily averages are equal. This does not show a reduction in daily use.
Now change one input. If Bill B instead shows 7,700 US gallons for those same 35 days, its daily average is 7,700 ÷ 35 = 220 US gallons per day. Compared with Bill A, that is a 10% increase in the daily average. Comparing the totals alone would give about 28.3%, mixing a longer period with a higher daily average.
Neither result explains why use changed. Guests, occupancy, irrigation and weather can still differ. A bill-wide average also hides when water was used. Keep a note of known changes, but do not assign a precise share of the increase to each one without measurements.
Resolve estimates before treating billed use as an interval measurement
Seattle Public Utilities’ high-bill guidance explains that an earlier estimate can be reconciled when an actual reading becomes available. Its page identifies an asterisk as the estimate marker on its own bills. Your utility may label estimates differently.
For example, if Bill A was estimated and Bill B includes a catch-up amount, dividing each billed total by days still produces arithmetic averages. Those numbers may not describe the water physically used within each separate period. Keep the estimate flag visible and ask which readings bound the actual-use interval. Do not quietly relabel an estimate as an actual measurement.
If the two bills use different units, convert before comparing. Confirm the bill’s multiplier: gallons, thousands of gallons, cubic feet and CCF are not interchangeable labels. When the unit or adjustment is unclear, record “comparison pending utility clarification.” That is more useful than a precise-looking percentage built on an unknown input.
Ask a question that preserves the original information
“Bill A shows 6,000 US gallons for 30 service days, and Bill B shows 7,000 for 35 days. I calculate 200 gallons per day for each. Could you confirm the service-day counts and units, whether both readings are actual, and whether either bill contains an adjustment?”
This is a complete follow-up for example 1. If the question is about a higher amount due, add the relevant charge names and dates privately when contacting the utility. Do not multiply a volume percentage by the whole bill to predict savings; fixed fees and other services may behave differently.
If you need a separate observation of current meter movement, record a no-use water-meter check with confirmed units and times. That short check answers a different question from a billing-period comparison. Neither calculation identifies a leaking fixture by itself.
A hardware or community information counter can help someone organize the question if that service is available. The utility remains the source for its own reading, adjustment and billing rules. A retail notebook is a place to keep information, not a billing or diagnostic instrument.
Keep the inputs, not just the percentage
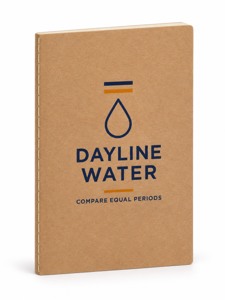
Your utility portal, an existing notebook or a spreadsheet may already do the job. For an information group choosing a separate record book, these custom notebooks for water-use comparisons provide a stitched A5 kraft-cover format with 80 blank sheets. The listed size is 8.26 × 5.83 inches; the current minimum is 12 books. A pen is not included.
Compare custom notebooks and padfolios, then confirm artwork and the selected configuration with DecentCustom. Keep the original service dates, unit and estimate status beside every calculated average. The illustrated cover is an AI concept, not a claim of measured water savings.